Broker Check
Stocks Post Best Week in Two Months

Stocks Post Best Week in Two Months

| September 26, 2016
Market Recap
Stocks Post Best Week in Two Months  (PDF Version)  (Additional Market Commentary)

September 26, 2016 – U.S. stocks finished moderately lower on Friday, as investors were put off by a sharp decline in oil; yet following three days of gains, the S&P 500 posted its strongest weekly gain in two months. Oil prices fell nearly 4% on Friday after Saudi Arabia failed to reach an agreement with Iran to cut crude oil production. A number of key technology stocks posted big gains last week, along with relatively safe, strong dividend-paying stocks that investors generally favor when uncertain about the economy. Real Estate, in its first full week of trading as the S&P 500’s newest major sector group, surged 4.3%, its best performance since July.

In key economic news last week, Federal Reserve FOMC members voted on Wednesday to leave interest rates unchanged for the sixth straight policy meeting. At her press conference following the announcement, Fed Chair Janet Yellen said the decision was not due to any lack of confidence in the economy but, instead, was “a calculation of cost and benefit” from low inflation, remaining labor market slack and the absence of strong pressure on manufacturing utilization (which might suggest overheating of the market). The FOMC’s next consideration for a rate hike is November 1-2, but with the national elections following so closely on November 8th, odds currently favor rate tightening to occur at the Fed’s December 14-15 meeting.

For the week, the S&P 500 gained 1.20%, the Dow Industrials added nearly 138 points (+0.76%), and the NASDAQ Composite advanced 1.18% and set a new all-time high on Thursday. All eleven major sector groups posted gains last week, led by the 4.30% surge in Real Estate Investment Trusts (REITs), Utilities (+3.37%), and Telecom (+1.92%). Energy (+0.10%) rose the least. The US Dollar Index weakened by 0.65%, finishing the week at 95.477. Despite the Friday pullback, crude oil futures gained 1.97% last week; while gold and silver futures jumped 2.09% and 4.79% respectively. U.S. government bond prices rose on Friday, capping their best weekly rally since the end of July. Ten-year Treasury note yields, which decline as prices rise, fell 7.4 basis points last week to 1.619%.


newspaper icon
Week’s Economic Calendar
 

Monday, September 26: New Home Sales, Dallas Fed Mfg Survey;

Tuesday, September 27: S&P/Case-Shiller Home Prices, Markit PMI Services, Consumer Confidence, Richmond Fed Mfg Index;

Wednesday, September 28: MBA Mortgage Applications, Durable Goods Orders;

Thursday, September 29: Jobless Claims, Corporate Profits, Final 2Q GDP Growth Rate, Intl Trade in Goods, Pending Home Sales;

Friday, September 30: Personal Income and Outlays, Chicago PMI, Consumer Sentiment.

Market Watch 

Stocks

1-Week

MTD

3-Month

YTD

1-Year

3-Year

Dow Jones Industrial Avg.

0.76%

-0.76%

1.39%

4.80%

12.15%

5.84%

S&P 500

1.20%

-0.18%

2.97%

7.62%

14.10%

10.66%

NASDAQ Composite

1.18%

1.82%

8.38%

6.95%

13.02%

13.47%

Russell 3000

1.37%

-0.01%

3.39%

8.00%

13.18%

10.07%

MSCI EAFE

3.15%

1.92%

2.23%

2.43%

6.77%

0.49%

MSCI Emerging Markets

3.64%

2.83%

10.84%

17.79%

18.61%

-1.00%

Bonds


Barclays Agg Bond

0.52%

-0.12%

1.52%

5.73%

5.34%

4.14%

Barclays Municipal

0.15%

-0.54%

0.42%

3.98%

5.96%

5.63%

Barclays US Corp High Yield

0.82%

0.27%

4.74%

14.66%

10.06%

5.02%

Commodities


Bloomberg Commodity

1.31%

1.89%

-4.48%

7.57%

-3.04%

-12.80%

S&P GSCI Crude Oil

1.97%

-0.49%

-11.24%

20.09%

0.00%

-24.55%

S&P GSCI Gold

2.40%

2.31%

6.22%

26.55%

18.54%

0.37%

Source: Morningstar

Chart of the Week: U.S. Housing Costs Are Rising
 
chart
View larger image »
 

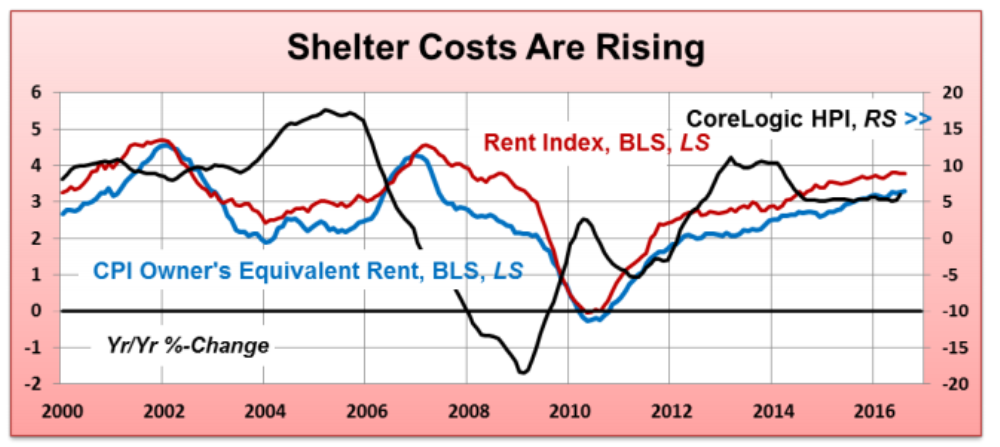
It is no surprise that shelter costs represent a large portion of the typical household budget. Accordingly, rent, paid either to a landlord or to oneself as an owner-occupant, has a large weighting in the Consumer Price Index (CPI) and the Personal Consumption Expenditures (PCE) deflator, the two major measures of U.S. consumer prices.

According to CoreLogic, which maintains the broadest index of home prices in the country, the rate of home price appreciation has picked up noticeably in recent months. As is shown in the chart above, the twelve-month rise in home prices (black line) rose to 6% in July, up from 5.2% the month before.

Home price inflation soared to 11.6% from February through July, up from just 1.6% in the previous five months. The Bureau of Labor Statistics’ Rent Index also continues to climb steadily, reaching 3.8% in August, the fastest rise since September 2008. Rentals constitute a little more than 7% of the entire CPI basket. The CPI component of Owners’ Equivalent Rent (OER) has reached 3.3%, the fastest rise since May 2007. This estimate is based on consumers who rent their primary residence and it comprises about 25% of the CPI. The OER inflation has consistently been slower than that of actual rentals.

 
Copyright © 2016 Cetera Investment Management LLC
All rights reserved.
200 N. Sepulveda Blvd, Ste 1200, El Segundo, CA 90245
Privacy Policy - Contact Us

This report is created by Cetera Investment Management LLC

About Cetera Investment Management®

Cetera Investment Management LLC is an SEC registered investment adviser owned by Cetera Financial Group®. It provides investment research, portfolio and model management, and investment advice to its affiliated broker-dealers, dually-registered broker-dealers and registered investment advisers.

Disclosures

The material contained in this document was authored by and is the property of Cetera Investment Management LLC. Cetera Investment Management provides investment management and advisory services to a number of programs sponsored by affiliated and non-affiliated registered investment advisers. Your registered representative or investment adviser representative is not registered with Cetera Investment Management and did not take part in the creation of this material. He or she may not be able to offer Cetera Investment Management portfolio management services.

Nothing in this presentation should be construed as offering or disseminating specific investment, tax, or legal advice to any individual without the benefit of direct and specific consultation with an investment adviser representative authorized to offer Cetera Investment Management services. Information contained herein shall not constitute an offer or a solicitation of any services. Past performance is not a guarantee of future results.

For more information about Cetera Investment Management strategies and available advisory programs, please reference the Cetera Investment Management LLC Form ADV disclosure brochure and the disclosure brochure for the registered investment adviser your adviser is registered with. Please consult with your adviser for his or her specific firm registrations and programs available.

No independent analysis has been performed and the material should not be construed as investment advice. Investment decisions should not be based on this material since the information contained here is a singular update, and prudent investment decisions require the analysis of a much broader collection of facts and context.

All information is believed to be from reliable sources; however, we make no representation as to its completeness or accuracy. The opinions expressed are as of the date published and may change without notice. Any forward-looking statements are based on assumptions, may not materialize, and are subject to revision.

The Barclays U.S. Aggregate bond Index is an unmanaged index composed of Barclays Credit government bond index, mortgage backed securities index, and asset backed securities index and is generally representative of the US Bond market.

The Barclays U.S. Corporate High Yield Index measures the market of USD-denominated, non-investment grade, fixed-rate, taxable corporate bonds. Securities are classified as high yield if the middle rating of Moody's, Fitch, and S&P is Ba1/BB+/BB+ or below, excluding emerging market debt.

The Barclays U.S. Municipal Bond Index is an unmanaged, market-value-weighted index of investment-grade municipal bonds with maturities of one year or more.

The Bloomberg Commodity Index is a broadly diversified index that allows investors to track commodity futures through a single, simple measure. It is composed of futures contracts on physical commodities and is designed to minimize concentration in any one commodity or sector. It currently includes 19 commodity futures in five groups. No one commodity can comprise less than 2% or more than 15% of the index, and no group can represent more than 33% of the index (as of the annual reweightings of the components).

The CBOE Volatility Index (VIX) is a key measure of market expectations of near-term volatility conveyed by S&P 500 stock index option prices. Since its introduction in 1993, VIX has been considered by many to be the world's premier barometer of investor sentiment and market volatility.

The Citigroup U.S. Economic Surprise Index is a weighted historical standard deviation measure of U.S. economic data surprises of actual data releases versus Bloomberg survey median levels. Calculated daily in a rolling three-month window, when the index is positive the reading suggests that economic releases have on balance [been] beating economists' consensus forecasts. The weights of economic indicators are derived from relative high-frequency spot foreign exchange impacts of 1 standard deviation data surprises. The indices also employ a time decay function to replicate the limited memory of markets.

The CRB Index is a pricing index that measures changes in the price of 22 commodities that are believed to be among the first to react to changes in economic conditions.

The Consumer Price Index (CPI) is a measure of the average change over time in the prices paid by urban consumers for a market basket of consumer goods and services.

The Dow Jones Industrial Average (DJIA) is a price-weighted average of 30 significant stocks traded on the New York Stock Exchange and the Nasdaq.

The MSCI EAFE Index (Europe, Australasia, Far East) is a free float-adjusted market capitalization index that is designed to measure the equity market performance of developed markets, excluding the US & Canada.

MSCI Emerging Markets is designed to measure equity market performance in global emerging markets. It is a float-adjusted market capitalization index.

The NASDAQ 100 Index is a modified capitalization-weighted index of the 100 largest and most active non-financial domestic and international issues listed on the NASDAQ. No individual listing can have more than a 24% weighting. Launched on February 1, 1985, the index carried a base value of 125.

The NASDAQ Composite Index includes all domestic and international based common type stocks listed on The NASDAQ Stock Market. The NASDAQ Composite Index is a broad based index.

The Russell 1000 Index comprises the 1,000 largest companies in the U.S. equity market, and is a subset of the Russell 3000 Index. The Russell 1000 is a market capitalization-weighted index, meaning that the largest companies constitute the largest percentages in the index, affecting performance more than the smallest index members. The inception date for the Russell 1000 and 3000 indices was January 1, 1984.

The Russell 3000 Index measures the performance of the largest 3,000 U.S. companies representing approximately 98% of the investable U.S. equity market.

The S&P 500 is an index of 500 stocks chosen for market size, liquidity and industry grouping (among other factors) designed to be a leading indicator of U.S. equities and is meant to reflect the risk/return characteristics of the large cap universe.

The S&P GSCI Gold Index, a sub-index of the S&P GSCI, provides investors with a reliable and publicly available benchmark tracking the COMEX gold future.

The S&P GSCI Crude Oil Index is a sub-index of the S&P GSCI and provides investors with a publicly available benchmark for investment performance in the crude oil market.

The U.S. Dollar Index is a weighted geometric mean that provides a value measure of the United States dollar relative to a basket of major foreign currencies. The index, often carrying a USDX or DXY moniker, started in March 1973, beginning with a value of the U.S. Dollar Index at 100.000. It has since reached a February 1985 high of 164.720, and has been as low as 70.698 in March 2008.

West Texas Intermediate (WTI) is a crude oil stream produced in Texas and southern Oklahoma which serves as a reference or "marker" for pricing a number of other crude streams. WTI is the underlying commodity of the New York Mercantile Exchange's oil futures contracts.